Big Data In Hadoop
Case Study: Covid 19 GIS Analysis
Olá 👋 I’m Ankita Sinha, an MTech CSE student doing a specialization in Information Security. You can connect with me on LinkedIn, and Github.Data is an incredibly significant portion of our life today. Data is a collection of raw facts and figures that is stored in databases. There are two types of data in terms of observation and measuring: qualitative data and quantitative data. Qualitative data is data that deals with observation i.e. based on the description and characteristics, and quantitative data are data that can be measured, hence in the form of numbers and dimensions. Further Qualitative data is described as the continuous and discrete form of data and quantitative data is described as binary, ordered, and unordered data [1]. Data are also divided in terms of structure i.e. format they are stored in that is structured data, unstructured data, and semi-structured data. Structure data is organized data stored in a predefined format based on the relationship between them like in a relational database, semi-structured data is varied type or partially organized data like in XML/RDF, and unstructured data do not have any format and is highly complex to understand until they are not processed [2].
In this era, everything you do or use on the internet, shopping, surveys, etc is nothing but data and when this data is huge, it is known as big data [3]. Big data is the collection of the huge amount of data that is collected by companies, governments, people, etc, while monitoring our usage, for example how much we spend in a period, transaction details of credit cards, surveys, health care details, sales detail of a product, etc are all nothing but big data, and these data keeps on growing exponentially. Big data is used to improve product placement, achieve better profit, customer satisfaction, improve safety, efficient operation, better decision making, etc [4]. Big data is collected either by people or machines, but all these data are raw data i.e. unstructured, unorganized, and meaningless data. By using various big data tools and operations the data is converted into meaningful data that can be used for any improvement, decision making, or prediction. The characteristics of big data are described in form of 7 v’s of big data as shown in the figure i.e. Variety, Volume, Velocity, Veracity, Variability, Visualization, and Value [3].

In big data, variety is the type of data i.e. social media data, health care data, etc, the volume is the size of big data that can in gigabytes, terabytes, etc, velocity is real-time analysis of usage activity, veracity is authenticity and accuracy of data, the variability of data constantly changes of data, visualization means the representation of data in graphs, etc, and value means while processing data it brings out the meaning of data.
Hadoop is an open-source apache framework. It is a distributed environment and allows users to store and process big data in different clusters in a system using programming languages like java and python or tools like apache pig, apache hive, apache impala, etc. Hadoop has mainly two major components i.e. Hadoop MapReduce and Hadoop distributed File System (HDFS). But in version 2.0 Hadoop Yarn was added to Hadoop. Yarn is responsible for resource management and job scheduling that was earlier done by MapReduce. MapReduce is a processing unit and HDFS is the storage unit [5]. The latest version 3.0.3 of Hadoop was introduced in 2018, the difference between Hadoop versions 2 and 3, is Hadoop 2 encourages single Name-Node and single standby Name-Node whereas Hadoop 3 encourages multiple standby Name-Node. Hadoop 2.7 is the stable version used for production.

The Hadoop ecosystem is a platform that provides various services for big data processing. Different tools can be used in the Hadoop ecosystem as shown in figure 3, It includes several tools that are used in big data processing like Pig, Hue, Hive, Impala, HBase, Sqoop, Spark, etc. Each tool work in different stages of big data processing. MapReduce and Spark are processing units, HDFS and HBase are storage units, Pig, Hue, and Impala are tools used for analyzing the data, Hue is used for data exploration and Sqoop is used for ingesting data [5].
Geographic information system (GIS) is further divided into geography and information system. It is an information system i.e. used for input, retrieve, manipulation, analysis, and output that is represented geographically. This type of data is known as geographical data which can be geospatial or big data. This type of data is useful for decision-making, planning, and management of the use of resources, environment, facilities, etc.
IMPLEMENTATION MODEL
Data can be obtained from diverse data sources i.e. machine data, organizational data, and people. Data integration in big data helps users to combine data from different sources and come up with a strategy. The benefits of data integration are adding value to big data, reducing data complexity, unifying your data system, increasing data availability, and increasing data collaboration [4]. Further, the integrated data is taken and transformed into a data model that gives it meaning. Then data analysis is done to achieve meaningful data.

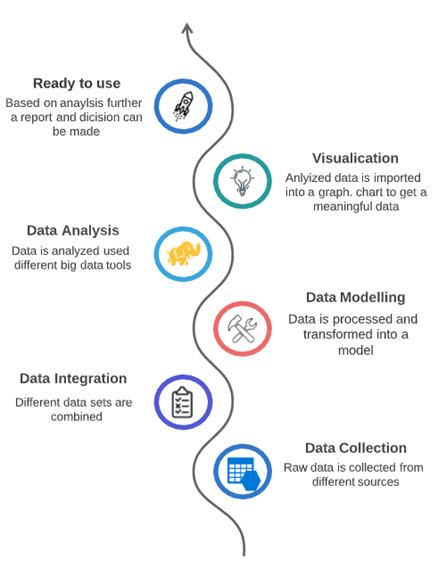
In response to the COVID-19 pandemic, numerous government and non-government organizations are providing the COVID-19 dataset. Using the Hadoop framework and ecosystem a data analysis will be performed in the order to come forward with a report regarding the number of cases, tests done, and healthcare requirements like beds, medicine, etc, in India. To perform this analysis 1. Data is collected from different data sources, 2. All the datasets are integrated 3. Big data model constructed and data is processed by using Hadoop tools i.e. HIVE, HDFS, MAP-REDUCE, etc., 4. Once the model is constructed then data analysis is started by performing queries on the data, 5. Using the result of data analysis a report is shaped to provide the data with meaning using GIS tools or graphs, and 6. This meaningful data report can be used by the organization for decision making and prediction as shown in the figure. Data analysis not only helps in the detection of a data error but also improves the quality of data, which is beneficial to everyone.
Code: Exploratory Data Analysis: Statistics Methods and Data Visualization.
Libraries: pandas 1.0.5, numpy 1.18.5, matplotlib 3.3.2, and seaborn 0.10.1
Link: https://github.com/AnkitaSinha98/COVID19-GIS-Analysis
REVIEW
COVID-19 has become a health concern due to its rapid spread of it and has caused social, human, and economic crises. Today there are 3,33,00,000 world-wide and 1000,000 deaths. The impact of the disease is specifically manifest in both developing and developed countries. Coronavirus disease is caused by the SAR-Cov-2 virus. This virus was discovered at the end of 2019 in China and the outbreak was declared at the start of 2020, worldwide according to WHO[1]. Data is collected from all over the world. These papers study the country-level counts of the cases across the country and based on the data collected and behavioral, socioeconomic, environmental, demographic, and topographic factors are taken as a parameter to analyze the data[3]. With the rapid increase of the cases, GIS and big data technologies play a vital role in many aspects i.e. spatial tracking of confirming cases, prediction of regional transmission, visualization of epidemic information, etc. COVID-19 is classified as the incubation period, strong infection, and difficult to detect, which has led to a sudden and rapid outbreak and growth. With the rapid spread, the information is also growing rapidly. A database is constructed on the knowledge of public opinion to guide the government. All the key risk area problem supply information, resources, etc are given with the representation. The traditional geographical data and big data are combined here and with the GIS technology, a graphical representation is given[2]. A GIS-based logistics monitoring system is established to identify highly active regions in an epidemic.
Challenges with GIS with spatiotemporal big data are rapid construction of the big data information, rapid problem-oriented big data integration, and acquisition, convenient multi-scale dynamic mapping, comparison between spatial tracking and spatiotemporal trajectory of big data, prediction of transmission speed and scale based on the spatiotemporal epidemic, spatial segmentation of epidemic risk and prevention level, the spatial dynamic balance of supply and demand for medical resources, risk assessment of the supply of transport and materials, estimate population flow and distribution and monitoring of the spread of the epidemic. Also, the mobility network and population migration all play a vital role in analysis i.e. spatial tracking[1].
The papers analyze the detailed reason for the lockdown and the efficacy in controlling the outspread virus. The outcome of the model and Thiessen polygon can be used to indicate the detailed foundation of controlling virus spread[3]. Also, the papers have given detailed deep learning and understanding of the pandemic situation[4]. The papers also state that future research will be carried out based on these numbers and the topographical spread of the prediction model for empathetic the problems at hand.
The John Hopkins University GIS dashboard was developed for monitoring global outbreaks like SARS, etc i.e. as the Canadian dashboard developed. Using ArcGIS, the John Hopkins GIS dashboard is developed for creating and using maps, compiling geographical data, analyzing mapped information, and managing information in databases. The dashboard has several panels like confirmed cases, total death cases, recovery cases, etc. i.e. scaled country and state by. Comparison based on the number of new confirm scales with new recovery cases were done. Google spreadsheets, CSV text-format were used now ESRI living Atlas is also included. Earlier all the separation based on countries and states was done manually but now everything is done using the dashboard which is less time-consuming. Also, maps can be customized using the dashboard. This made the JHU dashboard referred globally for monitoring coronavirus outbreaks. Based on data provided and the newly developed dashboard COVID-19 result was immediately replicated in various information systems using different approaches like POWER BI, R, Tableau, etc. that making it the global reference for health community and research purposes[7].
Project: https://github.com/AnkitaSinha98/COVID19-GIS-Analysis
REFERENCE
[1] Zhou, Chenghu, Fenzhen Su, Tao Pei, An Zhang, Yunyan Du, Bin Luo, Zhidong Cao, et al. 2020. “COVID-19: Challenges to GIS with Big Data.” Geography and Sustainability 1 (1): 77–87.
[2] Martellucci, Cecilia Acuti, Ranjit Sah, Ali A. Rabaan, Kuldeep Dhama, Cristina Casalone, Kovy Arteaga-Livias, Toyoaki Sawano, et al. 2020. “Changes in the Spatial Distribution of COVID-19 Incidence in Italy Using GIS-Based Maps.” Annals of Clinical Microbiology and Antimicrobials 19 (1): 1–4.
[3] Bherwani, Hemant, Saima Anjum, Suman Kumar, Sneha Gautam, Ankit Gupta, Himanshu Kumbhare, Avneesh Anshul, and Rakesh Kumar. 2020. “Understanding COVID-19 Transmission through Bayesian Probabilistic Modeling and GIS-Based Voronoi Approach: A Policy Perspective.” Environment, Development and Sustainability, no. 0123456789.
[4] Mollalo, Abolfazl, Behzad Vahedi, and Kiara M. Rivera. 2020. “GIS-Based Spatial Modeling of COVID-19 Incidence Rate in the Continental United States.” Science of the Total Environment 728: 138884.
[5] Kanga, Shruti, Gowhar Meraj, Majid Farooq, and Suraj Kumar Singh. 2020. “Risk Assessment to Curb COVID-19 Contagion: A Preliminary Study Using Remote Sensing and GIS,” 1–19.
[6] Sarwar, Suleman, Rida Waheed, Sahar Sarwar, and Aisha Khan. 2020. “COVID-19 Challenges to Pakistan: Is GIS Analysis Useful to Draw Solutions?” Science of the Total Environment 730: 139089.
[7] JOAO, BELMIRO. 2020. “Geographic Information Systems and COVID-19: The Johns Hopkins University Dashboard,” 1–20.
[8] Ahasan, Rakibul, Md. Shaharier Alam, Torit Chakraborty, and Md Mahbub Hossain. 2020. “Applications of GIS and Geospatial Analyses in COVID-19 Research: A Systematic Review.” SocArXiv, no. August.
